WHY Basel III

FLEXIBILITY
The user may define and change the required reports as needed.

SPEED
Due to previous data aggregation, the report is loaded extremely quickly.

READY - MADE TEMPLATES
Together with the implementation, we provide ready-made templates for the Liquidity Gap, LCR and NSFR reports.

HISTORY
Reports are supported for any day in history.
We also offer to build a separate data structure (data mart) for the purposes of BASEL III reporting. Such a structure allows to quickly generate adequate reports; additionally, our implementation contains an adjustment module to correct certain input data within a specified period in a fully auditable way if such data are missing from the source systems or have been input incorrectly.
Xares Tools is part of a complete range of our applications for finance and database solutions.
You are welcome to contact us. We will be happy to demonstrate our product.
Report Generation
With Xares Tools, you can create any tabular reports, including those required under BASEL III. The user may define any columns and lines of the report, including summary ones, and then assign values to each field that will be visible there. The image below shows the home screen for report mapping, the numbers in cells corresponding to the number of accounts that fulfil the filtering conditions for this field
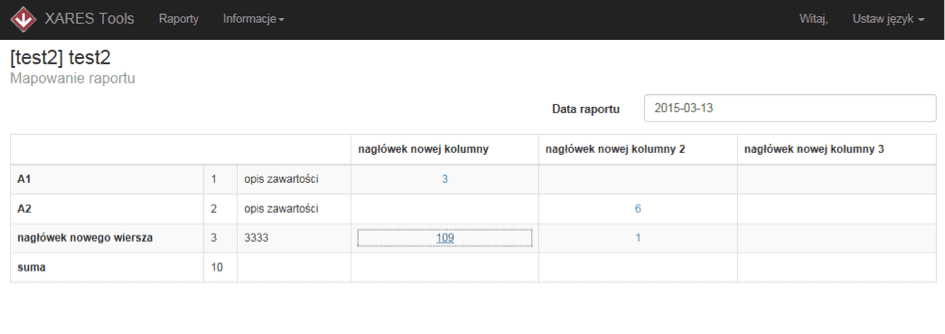
Report mapping home screen (the numbers correspond to the components that comply with the condition defined for the field).
The mapping as such follows the same pattern as in the case of component liquidity metrics in Xares and consists in defining filters. Likewise, in Xares Tools, any number of data sources may be defined, with five aggregating levels for each of them plus a label (DT/CR). For each filter, (up to three) weights are added along with the label that will be included in the respective cell (absolute value, label as in the source, label reversed as compared to the source). Each mapping is stamped with an expiration date, which in practice means that the report may be recalculated for any moment in time with the mapping effective at that moment.
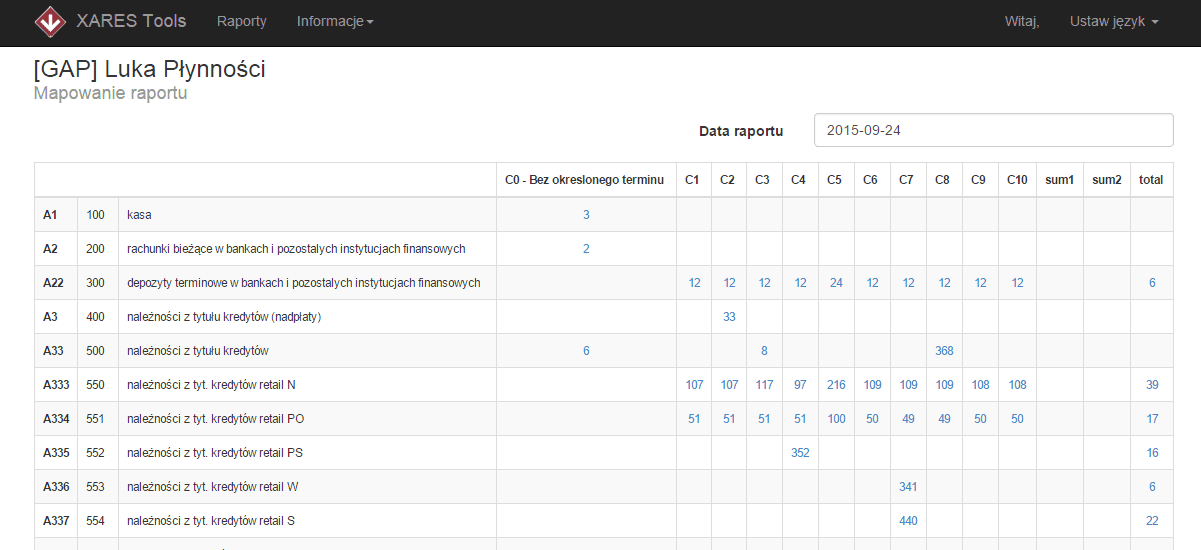
Mapping of a report - columns and lines.
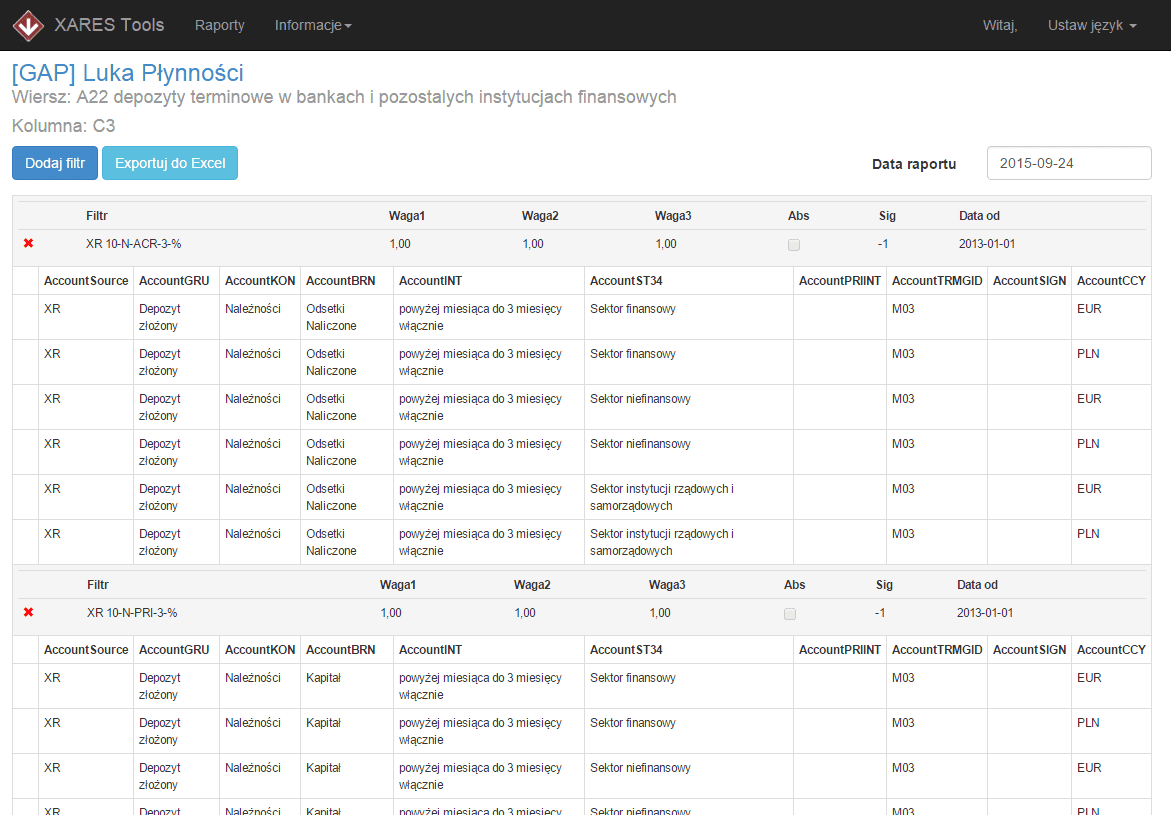
Mapping of a single field. Filter definitions for the specific data scope for the field are displayed.
The report now requires adequate data feed to the Xares Tools structure so that the mapping definitions can aggregate appropriate data to specific cells. We assume that the more atomic the data are, the simpler the creation of similar reports, while on the other hand overly detailed data may lengthen the report recalculation time. For instance, the most detailed breakdown, which may be aggregated in various ways in every report, was adopted for the reporting periods.
The result of the report definition and data integration is a complete report available in Report Services. A report may be called for any day.
You are welcome to contact us. We will be happy to demonstrate our new product.
Are you interested in our offer?
Regardless of whether it is a large application supporting financial management, data warehouse or a simple report - we will do it efficiently and effectively!